Human settlements
This section provides an assessment of the pressures on the environment from human settlement activities in the ACT. It covers the Territory’s growing population, its ecological footprint, energy consumption and generation, solid waste generation and management, transport, water resources, and water consumption.
Key findings
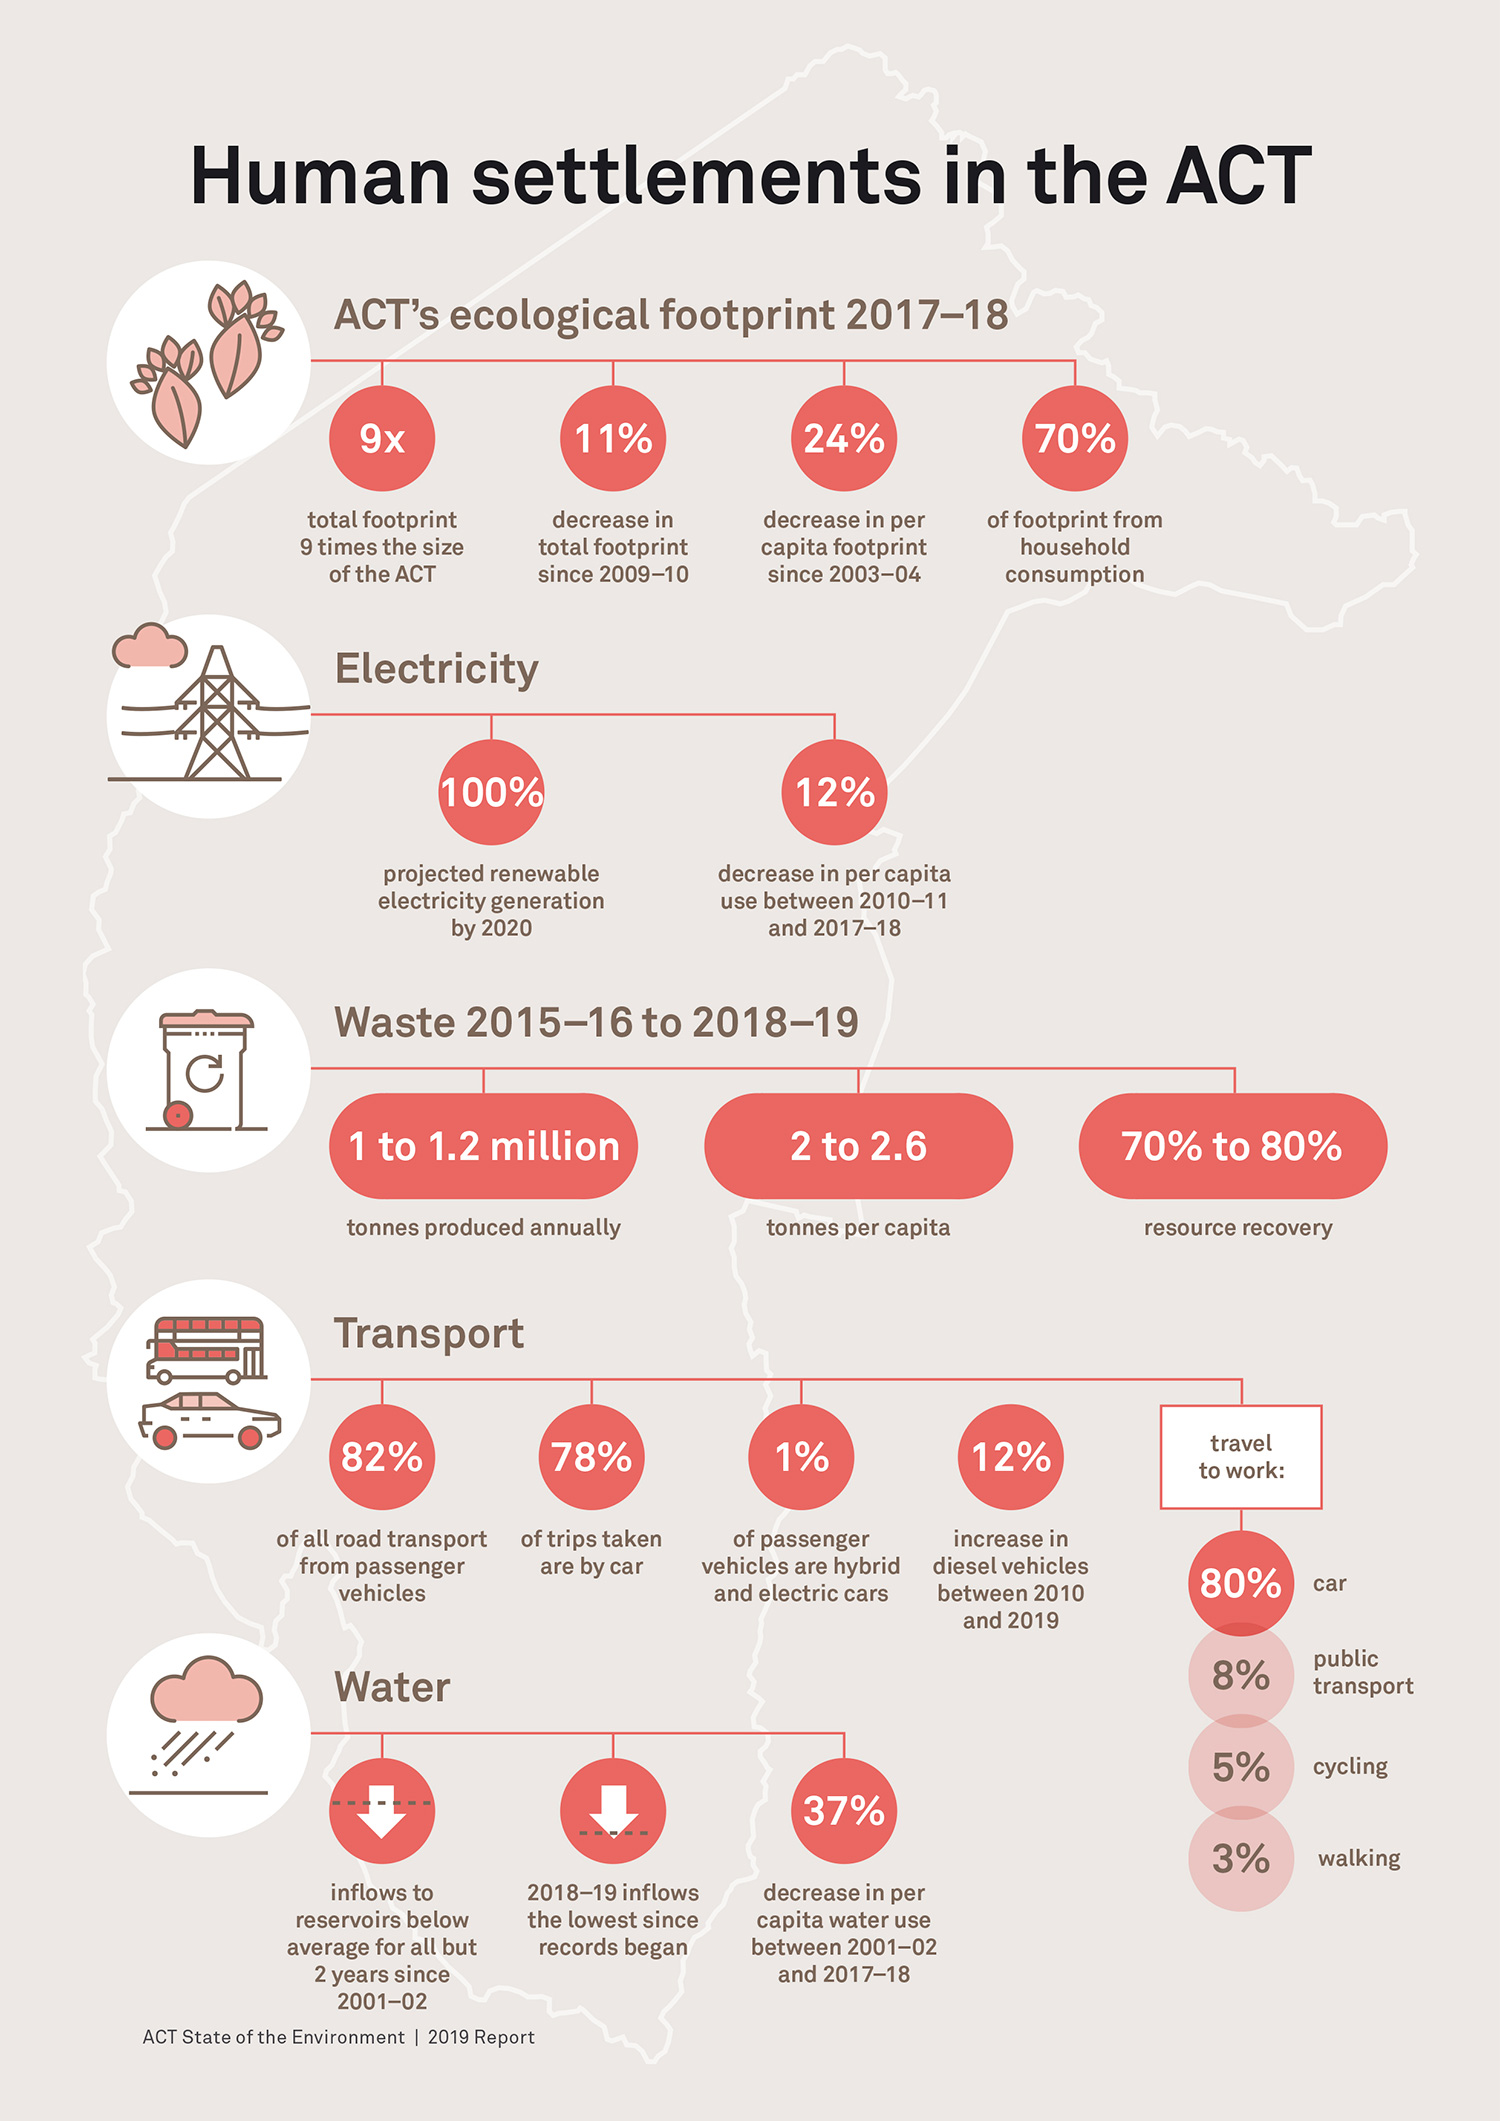
In 2017–18, the total ecological footprint was 9 TIMES the size of the ACT
Cars account for 78% of all trips undertaken
12% decrease in per capita electricity use between 2010–11 and 2017–18
Around 75% of waste is recovered
Background
A range of human settlement activities impact on the environment. The use of energy (including transport energy) and water, as well as the consumption of goods and services, place pressure on the environment through demands on resources and waste generation.
Population is a key driver of environmental pressure from human settlement activities. As the population increases, so does the demand for energy and resources, the amount of waste generated, and the need for land development for infrastructure, housing, and energy production.
Consequently, everyday decisions made by the community are critical to reducing human settlement pressures on the environment. For example, minimising vehicle use, increasing water and energy efficiency in the home, reducing the consumption of goods, choosing products that are better for the environment, and improving recycling and reuse.
The consumption of fuels and the generation of waste are also the major source of air pollution and greenhouse gas emissions in the ACT. Information on air quality can be found in the Air section, and information on and greenhouse gas emissions can be found in Indicator CC3: Greenhouse gas emissions.
Key actions
That the ACT Government:
promote and support sustainable household consumption to further decrease the ACT’s ecological footprint.
encourage the development and uptake of distributed energy storage and microgrid technology in domestic, commercial and government buildings and infrastructure to ensure energy supply is sufficient to meet the likely increased demands of the ACT’s growing population and periods of high usage due to climate change.
develop strategies to move toward a circular economy to improve waste recovery rates and reduce resource consumption and waste to landfill.
develop strategies to improve the uptake of public transport and active travel, including increasing cycling participation across gender and age groups.
provide incentives to encourage the purchase of electric and hybrid vehicles, and reduce the purchase of diesel powered vehicles.
identify opportunities to develop water–sensitive urban design across new and existing urban areas. This urban design should incorporate integrated water cycle management to enable the capture and use of stormwater, and create habitat for ACT’s biodiversity.
increase wastewater recycling and use across the ACT for non-potable water needs.
Indicator dashboards
HS1: ACT’s ecological footprint
The ACT’s ecological footprint is over 9 times the size of the land area of the ACT, showing that current resource use is unsustainable. Although the ecological footprint is decreasing over time, particularly with the growth in renewable electricity, significant further cuts are required. Households are responsible for 70% of the ACT’s footprint; consequently, decreases in community resource consumption will greatly reduce both the ecological and carbon footprints for the ACT.
- Poor
- Fair
- Good
HS2: energy consumption and generation
Due to lack of data, this assessment is limited to electricity consumption and generation. ACT’s electricity consumption has remained stable, despite population growth, reflecting an ongoing decline in per capita usage. The share of renewable electricity generation has increased significantly and is forecast to reach 100% in 2020.
- Poor
- Fair
- Good
HS3: Solid waste generation and management
The lack of comprehensive and consistent waste data, and high annual variations in waste produced, makes it difficult to assess the status of waste in the ACT. There are no apparent trends indicating long-term changes in the total amount of waste generated, recovered or landfilled. However, the annual resource recovery rate is generally good at around 70% to 75% of the total waste generated, although this has not improved over the last 10 years. Municipal solid waste accounts for the highest proportion of waste sent to landfill and its generation appears to be stable despite the annual population increase in the ACT.
- Poor
- Fair
- Good
HS4: Transport
The ACT community maintains a high dependence on cars for transport with the number of registered vehicles and their usage increasing. Cars are used for around 80% of all trips undertaken including commuting to work. Public transport, cycling and walking only represent 16% of all travel to work, although public transport use has increased over recent years. Car use contributes to air pollution and greenhouse gases, and has significantly increased road congestion in the ACT. Only 1% of vehicles in the ACT are electric or hybrid.
- Poor
- Fair
- Good
HS5: Water resources
CT’s water resources continue to be affected by a long-term period of mostly dry conditions. In 2018–19, total inflows to the ACT’s 4 drinking supply reservoirs was 32 gigalitres, the lowest since records began in 1912, and 86% below the long-term average. At the end of June 2019, the ACT’s 4 reservoirs were holding just 57% of the total ACT storage capacity. Over the past 10 years, only 12–17% of the total wastewater produced is recycled in the ACT.
- Poor
- Fair
- Good
HS6: Water consumption
The ACT and Queanbeyan’s total water consumption has remained fairly consistent since 2012–13 at around 50,000 megalitres annually despite population growth. Between 2001–02 and 2017–18, residential per capita water use dropped from 124 kilolitres per year to 78 kilolitres litres per year, a decrease of around 37%. Residential supply is responsible for most of the water use in the ACT, accounting for around 60% of the total supplied annually.
- Poor
- Fair
- Good
Indicator assessment legend
- Poor
- Fair
- Good
Environmental condition is healthy across the ACT, OR pressure likely to have negligible impact on environmental condition/human health.
- Poor
- Fair
- Good
Environmental condition is neither positive or negative and may be variable across the ACT, OR pressure likely to have limited impact on environmental condition/human health.
- Poor
- Fair
- Good
Environmental condition is under significant stress, OR pressure likely to have significant impact on environmental condition/ human health.
- Poor
- Unknown
- Good
Data is insufficient to make an assessment of status and trends.
Improving
Deteriorating
Stable
Unclear
Adequate high-quality evidence and high level of consensus
Limited evidence or limited consensus
Evidence and consensus too low to make an assessment
Assessments of status, trends and data quality are not appropriate for the indicator
Data summaries
Population
In 2018, the ACT’s population was approximately 423,000.
In the 10-year period between 2008 and 2018 the population grew by approximately 72,000 people, an average annual increase 1.7% per year.
Districts with the highest population include Belconnen (24%), Tuggeranong (21%), Central Canberra (20%) and Gungahlin (18%).
Gungahlin experienced the highest population growth, accounting for over 50% of total growth over the decade to 2016. Belconnen and North Canberra both grew by around 11,000 people over the same period.
The ACT’s population is projected to increase to around 589,000 people by 2041.
Footprint
In 2017–18, the total ecological footprint for the ACT was around 2.12 million hectares. This is over nine times the size of the ACT and shows that current resource use is unsustainable.
The ACT’s ecological footprint has consequences for areas of Australia and overseas that provide the resources, goods and services consumed by the ACT community.
Since 2009–10, the total ACT ecological footprint has decreased by nearly 11%.
In 2017–18, the per capita footprint was 5.24 hectares, a decrease of nearly a quarter since 2003–04. The ACT’s per capita ecological footprint is now equivalent to that for the average Australian.
Since 2009–10, the total carbon footprint decreased by over 20% and the per capita carbon footprint by 34%. The per capita ACT carbon footprint is now 11% lower than that of Australia.
Household final consumption of goods and services is responsible for 70% of the ACT’s ecological footprint.
ACT’s ecological footprint is dominated by land disturbance from the pasture required for animal products. However, in per capita terms, the area of land disturbance from pasture requirements decreased by 23% between 2003–04 and 2017–18.
Land disturbance from emissions declined by one-third between 2003–04 and 2017–18 reflecting the ACT’s growing renewable electricity supply.
Impacts from food expenditure accounted for 50% of the ACT’s total ecological footprint in 2017–18.
Expenditure on mobility accounted for 25% of the total carbon footprint in 2017–18 compared to 19% in 2003–04. Transport will likely become the highest contributor to the ACT’s carbon footprint in the future.
Energy
Data on the ACT’s energy use is not sufficient to enable a comprehensive assessment of the ACT’s energy generation and consumption. This includes a lack of data on energy consumption for fuel types other than electricity, and the consumption of energy by sector.
Electricity demand in the ACT is stable, despite population growth.
Electricity consumption per capita decreased by 12% between 2010–11 and 2017–18.
The ACT’s total renewable electricity generation increased significantly between 2015–16 and 2017–18, rising from 20% to nearly 50% of electricity generated.
Predicted renewable electricity generation for the period 2018–19 to 2020–21 shows that the ACT is forecast to reach 100% in 2020.
The ACT will be the first jurisdiction in Australia and the eighth jurisdiction globally, to procure renewable generation equivalent to 100% of its consumption.
Wind farms supply the majority of the ACT’s renewable electricity.
Wind farm generation significantly increased from 7% in 2016–17 to over 50% in 2018–19, and will supply over 70% of total renewable electricity in 2019–20 and 2020–21.
Rooftop solar photovoltaic generation continues to be installed in the ACT and has increased its share of renewable electricity generation in recent years.
The only renewable electricity generated in the ACT comes from solar farm and rooftop solar generation.
Waste
Waste data currently excludes waste exported outside the ACT. This means that the data reported understates the actual volume of waste sent to landfill.
Total waste generation, waste to landfill and resources recovered are highly variable in the ACT with changes mostly occurring in response to specific activity from the construction and demolition sector (including the Mr Fluffy program) as well as increases in garden waste.
The annual total waste generated in the ACT between 2009–10 and 2018–19 ranged from 816,000 to 1.2 million tonnes, with no consistent trend over time.
Between 2009–10 and 2018–19, annual landfill per capita ranged from 0.5 to 1.1 tonnes per person, resources recovered from 1.2 to 2 tonnes per person, and total waste between 2 and 2.6 tonnes per person with no consistent trend over time.
Resource recovery is generally much higher than waste sent to landfill, with most years recording a resource recovery rate of 70% or higher.
Annual resource recovery in the ACT has plateaued to around 70% to 75% of the total waste generated or 0.55 tonnes per person (excluding the Mr Fluffy program).
Waste from the Mr Fluffy program accounted for 40% (202,000 tonnes) of the total waste sent to landfill in 2016–17. This declined to 5% (12,000 tonnes) in 2018–19 with the majority of the program completed.
Excluding the Mr Fluffy program, between 2016–17 and 2018–19, municipal solid waste accounted for the highest proportion of the annual total waste sent to landfill (between 39% and 49%), closely followed by commercial and industrial waste (between 35% and 47%). Construction and demolition waste varied widely over the period, from 25% of the total waste sent to landfill in 2016–17, to only 6% and 9% in the following years.
Total municipal solid waste generation appears to be stable despite the annual population increase in the ACT. This may indicate improved recycling behaviours and/or changes in the consumption of goods and services leading to a decline in waste per person.
During the reporting period, ACT was found to comply with the National Environment Protection Measures related to waste management (includes the Movement of Controlled Waste between States and Territories, and Used Packaging Materials).
Transport – Private vehicle use
The ACT community is highly dependent on cars which are used for 78% of all trips undertaken. Public transport is only used for 4% of trips and cycling only 2%.
Although the most common purpose for car travel was work related, cars are the main transport choice for a range of daily activities.
Cars were used for over 80% of travel to work with most commuting undertaken with the driver as the sole vehicle occupant. Public transport was used for only 8% of travel to work, cycling 5% and walking 3%. There was little change in travel-to-work transport modes between 2011 and 2016.
The number of registered vehicles in the ACT has grown from around 253,000 vehicles in 2010 to 304,000 in 2018, an increase of 20%. Passenger vehicles were responsible for 84% of total vehicle registrations and light commercial vehicles 10%.
Vehicle usage is increasing in the ACT. In 2018, ACT’s registered vehicles travelled nearly 3,900 million kilometres, with passenger vehicles responsible for 82% of the total kilometres travelled. The next most common category was light commercial vehicles accounting for 13% of kilometres travelled.
Between 2002 and 2017, daily commute times increased by 65% in the ACT, the highest of any Australian city. The ACT’s mean daily commute time in 2017 was 52 minutes, which means that the ACT’s commute times are approaching those recorded in other Australian cities.
In 2019, 86% of registered passenger vehicles were fuelled by petrol making it the dominant fuel type in the ACT.
Diesel fuelled 12% of vehicles in 2019, a threefold increase since 2010. The large increase in diesel vehicles is of concern given their increased impact on air pollution, especially particulate matter emissions.
Hybrid and electric cars only make up 1% of the total passenger vehicles in the ACT but, in terms of vehicle numbers, have increased from around 150 in 2010 to nearly 2,900 in 2019. The ACT, along with South Australia, have the highest number of electric car purchases in Australia, with 21 electric cars per 10,000 vehicles sold.
Transport – Public transport and active travel
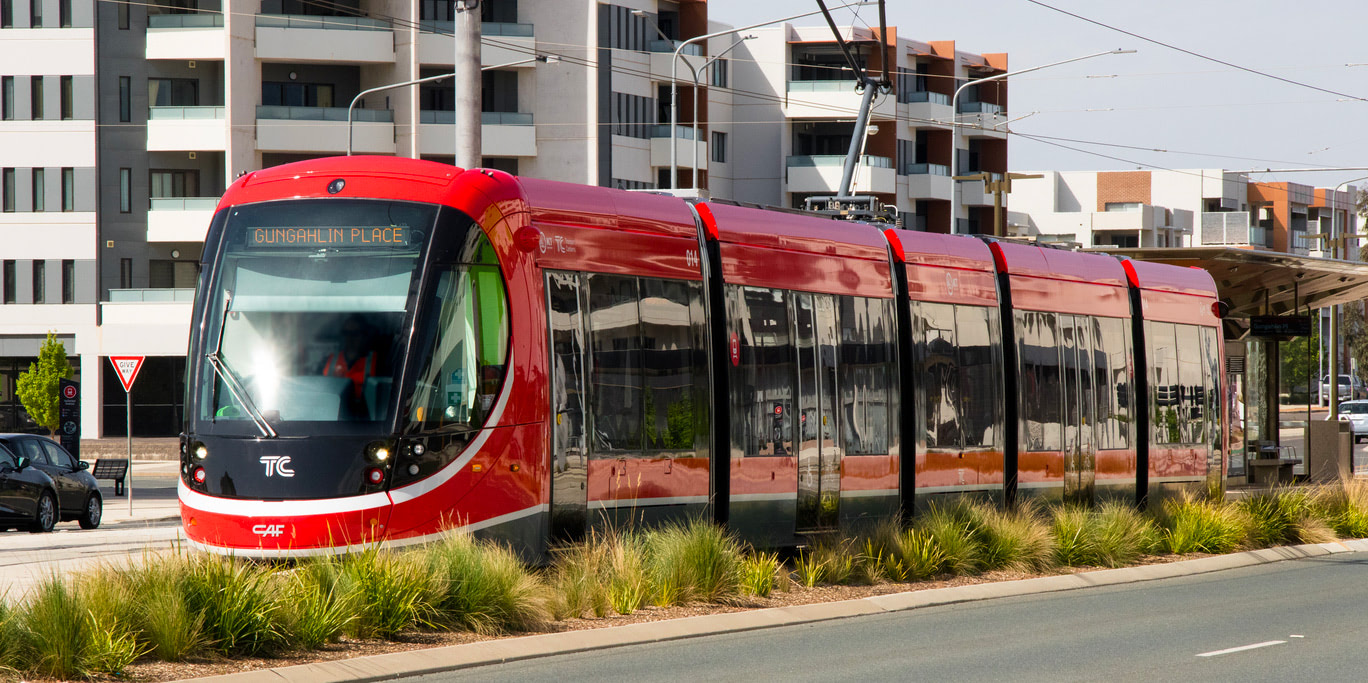
Public transport use has been increasing in recent years, growing from 17.6 million boardings annually (45 boardings per capita) in 2014–15 to 20.1 million (48 per capita) in 2018–19.
The 2018–19 figures include nearly 878,000 light rail boardings in just over two months between its commencement on 20 April 2019 and 30 June 2019.
Cycling is highly variable across the ACT with the Civic area having a significantly higher uptake of cycling, likely due to a flatter terrain and shorter distances to work and study centres.
Between 2011 and 2019, cycling participation in the ACT was higher than the national average. Despite this, there are wide variations in year-to-year cycling participation and a statistically significant decline in ACT’s weekly cycling participation between 2017 and 2019.
In 2019, the ACT had some 3,100 km of shared paths and some 600 km of on-road cycling facilities. Given the high level of cycling infrastructure in the ACT, there is much scope for improving cycling participation, including across gender and age groups.
Water resources
During 2018–19, total inflow to the ACT’s four reservoirs was 32 gigalitres, the lowest since records began in 1912, and 86% below the long-term average.
ACT’s water resources are being affected by a long-term period of mostly dry conditions.
Water availability has declined significantly in the ACT with mean storage volumes around 40% below the long-term average for the past 20 years.
Between 2001–02 and 2018–19, total inflows to the ACT’s four reservoirs were below the long-term average for all but two years.
At the end of June 2019, the ACT’s four reservoirs were holding just 57% (157 gigalitres) of the total ACT storage capacity. This is despite the enlargement of the Cotter Dam in 2013 which increased the ACT’s water storage by 72 gigalitres.
Without the increase to the Cotter Dam, the combined ACT storages would have dropped to around 30% of their total capacity – similar to levels during the Millennium Drought.
Between 2009–10 and 2018–19, there was little variation in the ACT’s wastewater recycling with volumes remaining around 4,000 megalitres to 4,500 megalitres, representing around 12% to 17% of the ACT’s total wastewater produced.
The majority of the ACT’s treated wastewater is discharged into the Molonglo River providing environmental flows, protecting riverine ecosystems and providing for downstream use.
Potable water consumption
The ACT and Queanbeyan’s total water consumption has remained fairly consistent since 2012–13 at around 50,000 megalitres annually, despite increases in the population serviced.
Water usage in 2017–18 was 54,000 megalitres, the highest volume over the past 10 years. This increase has been driven by hotter and drier weather conditions and is not necessarily indicative of an increasing trend in water usage.
Between 2001–02 and 2017–18, residential per capita water use dropped from 124 kilolitres per year to 78 kilolitres per year, a decrease of around 37%.
The ACT uses over 90% of the water supplied, with Queanbeyan using around 8%.
Residential supply accounts for around 60% of the total water supplied annually, this has remained consistent since 2008–09.
Most gains in water use efficiency can be made at the household level.