HS2: energy consumption and generation
Due to lack of data, this assessment is limited to electricity consumption and generation. ACT’s electricity consumption has remained stable, despite population growth, reflecting an ongoing decline in per capita usage. The share of renewable electricity generation has increased significantly and is forecast to reach 100% in 2020.
- Poor
- Fair
- Good
Indicator assessment legend
- Poor
- Fair
- Good
Environmental condition is healthy across the ACT, OR pressure likely to have negligible impact on environmental condition/human health.
- Poor
- Fair
- Good
Environmental condition is neither positive or negative and may be variable across the ACT, OR pressure likely to have limited impact on environmental condition/human health.
- Poor
- Fair
- Good
Environmental condition is under significant stress, OR pressure likely to have significant impact on environmental condition/ human health.
- Poor
- Unknown
- Good
Data is insufficient to make an assessment of status and trends.
Improving
Deteriorating
Stable
Unclear
Adequate high-quality evidence and high level of consensus
Limited evidence or limited consensus
Evidence and consensus too low to make an assessment
Assessments of status, trends and data quality are not appropriate for the indicator
Background
- Background
- How does the ACT’s renewable electricity program work?
- Electricity consumption
- Renewable electricity generation
This indicator assesses ACT’s energy use. For greenhouse gas emissions see Indicator CC3: Greenhouse gas emissions and for air pollution resulting from energy generation and use see Indicator A1: Compliance with air quality standards.
Energy is central to everyday life for both social and economic activity. The level of energy use is determined by a range of factors including population and economic activity. Another significant driver of energy use is climate through increased demand for heating and cooling. Consequently, climate change will increase energy demand in the future with more frequent hot days and heatwave periods although this may be partially offset by a reduction in colder temperatures (see Indicator CC1: Climate trends).
The environmental impacts of energy use are determined by the type of generation. Non-renewable energy based on fossil fuels (including transport fuels) make significant contributions to greenhouse gas emissions and air pollution. They also impact on the environment through land use changes (both resource extraction and infrastructure requirements) that cause habitat loss and degradation of land and water, and can require high levels of water consumption. Renewable energy such as solar, wind and hydro-electricity have substantially lower environmental impacts, particularly for greenhouse gas emissions and air pollution, but can still impact on the environment through land use change and the use of hazardous material for construction and maintenance. Hydro-electricity also affects aquatic health due to the alteration of river flows.
Regardless of generation type, it is vital to reduce energy demand to minimise environmental impacts. With the population increasing in the ACT, reducing energy usage and improving energy efficiency will negate the need for new energy generation infrastructure.
With the ACT moving to 100% renewable energy for electricity generation, transport will become the main focus for further reductions in non-renewable energy consumption. Reductions will necessitate an increase in the number of electric vehicles, which combined with renewable energy for charging, will further reduce ACT’s energy consumption impacts. In addition, the phasing out of natural gas will also be important.
It was not possible to obtain data for the ACT’s energy consumption by fuel other than for electricity. Consequently, natural gas, petroleum and other fuel types are not reported here. It was also not possible to obtain data on energy consumption by sector. These are key data gaps which prevent a comprehensive assessment of the ACT’s energy consumption and generation. For example, reporting on electricity alone excludes the contributions of oil and petroleum fuels which have been shown to account for the majority of energy consumption in most Australian jurisdictions.
How does the ACT’s renewable electricity program work?
Although the ACT will shortly reach 100% renewable electricity, it remains connected to the national electricity grid. This means that the ACT still receives electricity generated from non-renewable sources which may be consumed at any time. However, the ACT has purchased enough renewable energy to meet its electricity needs. This renewable electricity is available to the national grid and is used in other parts of Australia, offsetting the non-renewable energy consumed in the ACT. This is a system used by most of the European jurisdictions that have moved to 100% renewables. The system also allows the ACT to keep using the national grid which is important during periods of high demand.
The ACT’s renewable energy was purchased using what is known as a reverse auction, where companies were invited to bid to supply renewable energy at the lowest price for the ACT. This has resulted in the development of new renewable energy generation.
Ideally, all electricity should come directly from renewable sources where possible. However, this would be difficult for the ACT and other jurisdictions to achieve where sufficient generation opportunities are not available. Consequently, supplying renewable electricity into the national grid is an effective means to achieving 100% renewable electricity, and to reduce the impacts of energy use on the environment.
Condition and trends
Electricity consumption
Total electricity demand for the ACT and use per capita is shown in Figure HS11. Electricity demand in the ACT is relatively stable, despite population growth. This is due to reductions in electricity consumption per capita which decreased by 12% between 2010–11 and 2017–18. This decrease is likely due to a stronger focus on energy efficiency such as the uptake of energy efficient appliances, as well as general efforts to moderate electricity consumption and consumer response to price rises.
Figure HS11: ACT total and per capita electricity demand, 2010–11 to 2017–18.
Renewable electricity generation
The ACT’s total renewable electricity generation significantly increased between 2015–16 and 2017–18, rising from 20% to nearly 50% of electricity generated (Figure HS12). Predicted renewable electricity generation for the period 2018–19 to 2020–21 shows that the ACT is forecast to reach 100% in 2020. This significant achievement means that the ACT Government’s renewable electricity consumption target of 100% by 2020 will be met. Environment and Planning Directorate, 2016, Canberra 100% Renewable: Leading Innovation with 100% Renewable Energy by 2020, ACT Government, Canberra It also means that the ACT will be the first jurisdiction in Australia, and the eighth jurisdiction globally with a population over 100,000, to achieve the transition from an electricity supply based largely on fossil fuels to procuring renewable generation equivalent to 100% of its consumption. Cass, D., 2019, Class ACT. How the Australian Capital Territory Became a Global Energy Leader, The Australia Institute, Canberra (accessed 6 October 2019). In addition, the ACT will be the first jurisdiction outside Europe to achieve 100% renewable electricity.
Figure HS12: Total renewable electricity generation for the ACT, 2010–11 to 2017–18, and projected renewable generation for 2018–19 to 2020–21.
Wind farms supply the majority of the ACT’s renewable electricity. Wind farm generation significantly increased from 7% in 2016–17 to over 50% in 2018–19, and will supply over 70% of total renewable electricity in 2019–20 and 2020–21 (Figure HS13). The second largest renewable electricity source for the ACT comes from the ACT Government’s mandatory contribution to the national renewable energy target. This accounts for around 20% of ACT’s renewable electricity and has remained fairly consistent, increasing by around 1% per year.
Figure HS13: Sources of renewable electricity generation for the ACT, 2016–17 to 2020–21.
Solar farm and rooftop solar generation each account for 3% of the current renewable electricity. Rooftop solar PV generation continues to be installed in the ACT, and despite the large increases in other generation, has increased its share of renewable electricity generation in recent years.
The location of the ACT’s wind and solar farms supplying the National Electricity Market are shown in (Figure HS14). The only renewable electricity generated in the ACT comes from solar farm and rooftop solar generation. The bulk of the power from wind farms and the national renewable energy target are sourced from outside the ACT. There are currently five wind farms, one in South Australia, two in Victoria, and two in NSW.
Figure HS14: Location of the ACT’s wind and solar farms supplying the National Electricity Market
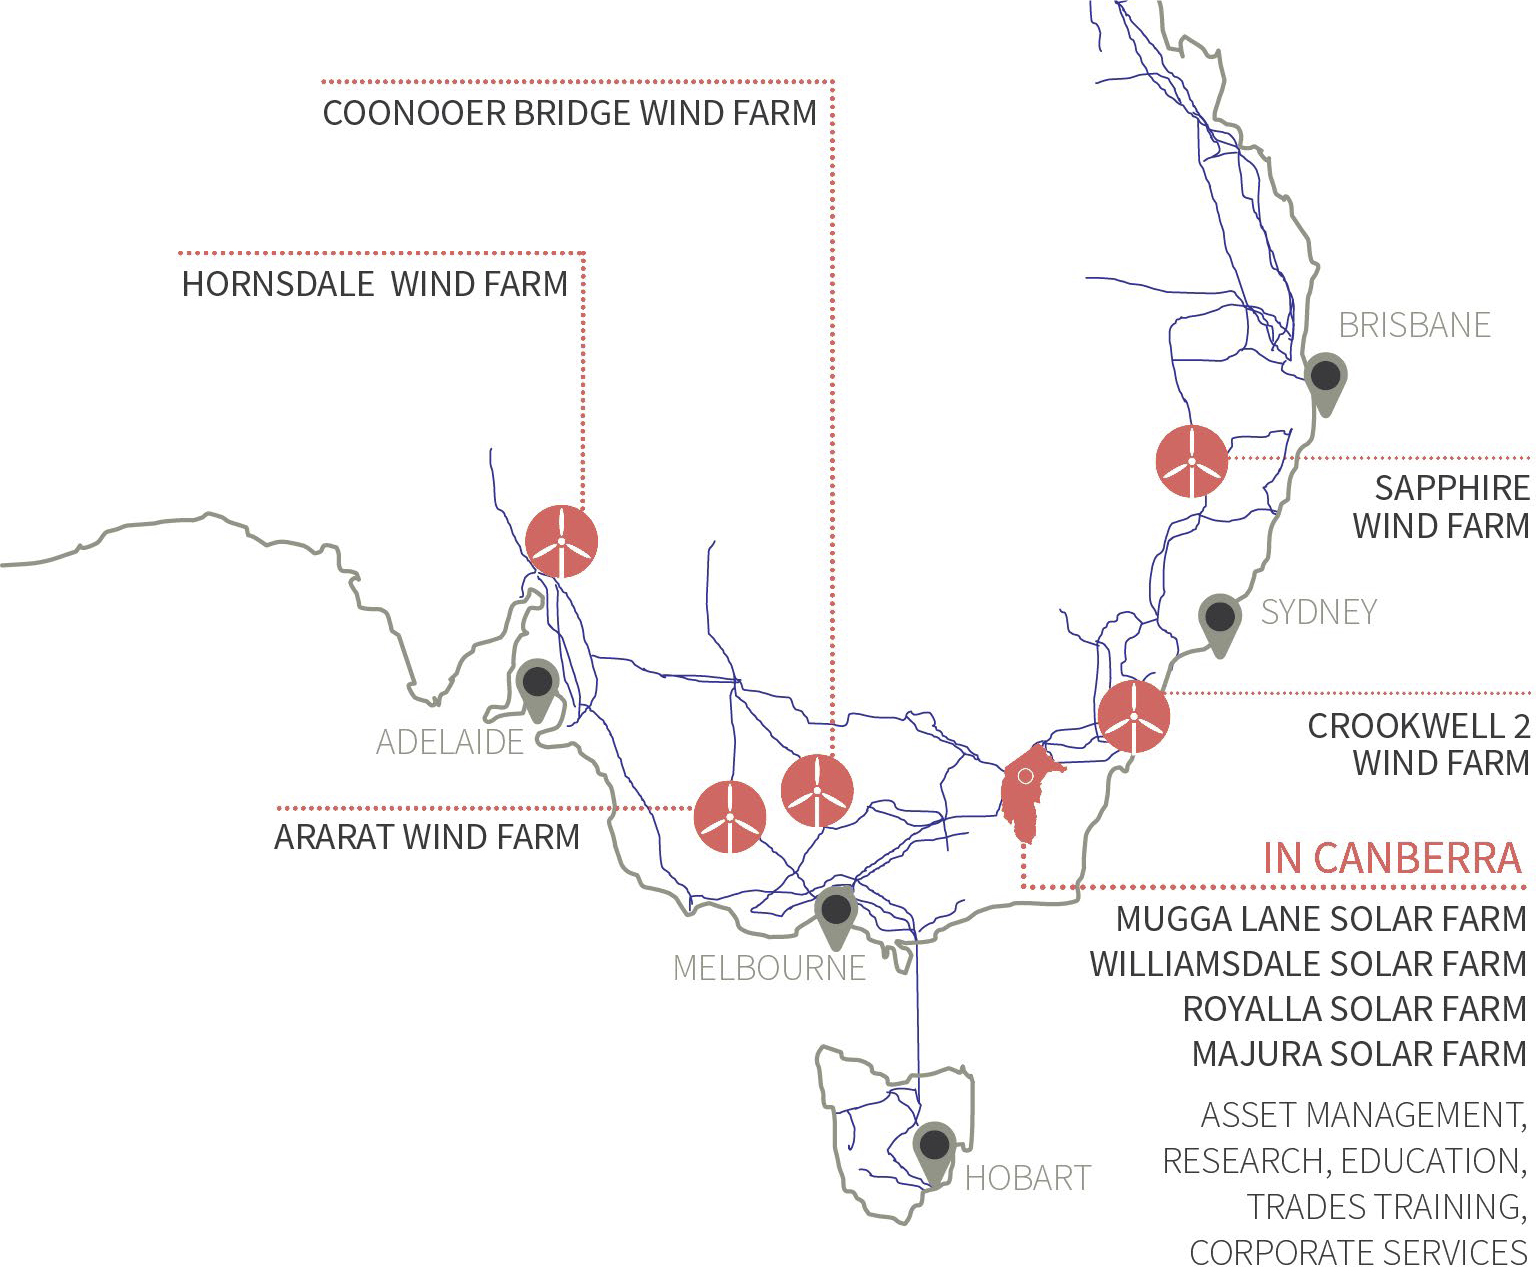
Source: Environment, Planning and Sustainable Development Directorate, 2016, Canberra 100% Renewable: Leading Innovation with 100% Renewable Energy by 2020, ACT Government, Canberra.